Generate an allocation graph which contains non-stationary allocations data only
nonstat_alloc_graph.RdCreates an allocation graph from a completed allocation table,
mostly likely created by the assemble_fu_allocation_tables() function.
Usage
nonstat_alloc_graph(
  .df,
  country,
  ef_product,
  destination,
  year = IEATools::iea_cols$year,
  .values = IEATools::template_cols$.values,
  machine = IEATools::template_cols$machine,
  eu_product = IEATools::template_cols$eu_product,
  machine_eu_product = paste0(machine, "_", eu_product)
)
Arguments
- .df
A data frame comprised of completed final energy allocations.
- country
The country for which this graph applies.
- ef_product
The final energy product for which this graph applies.
- destination
The destination sector for the final energy product.
- year
See
IEATools::iea_cols.- .values, machine, eu_product
- machine_eu_product
The name of a combined
machineandeu_productcolumn.
Details
This function is called repeatedly from nonstat_alloc_plots_df().
country, ef_product, and destination form the title of the graph.
Examples
library(ggplot2)
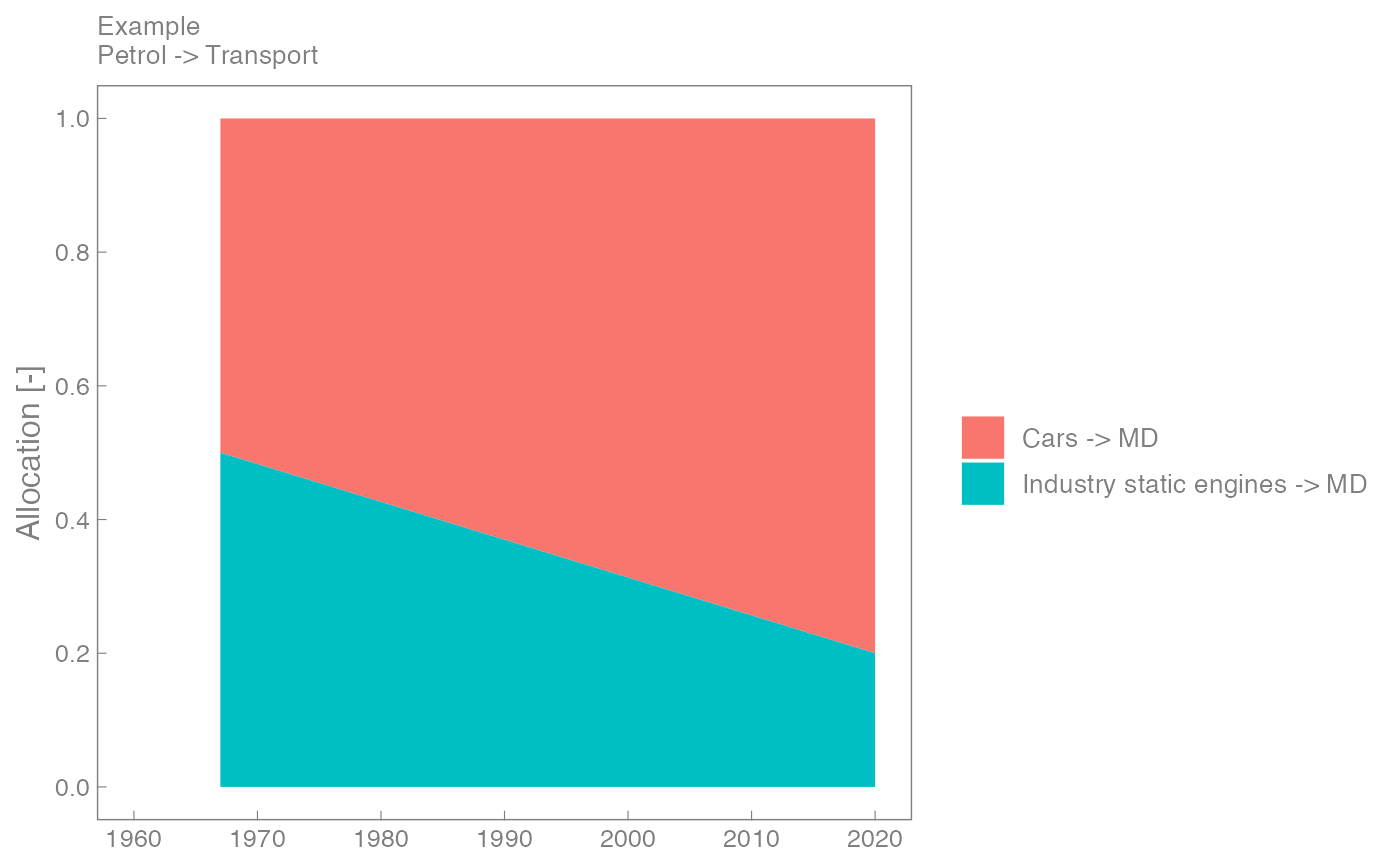
# Make a simple data frame with the expected structure.
tibble::tribble(~Year, ~.values, ~Machine, ~Eu.product,
1967, 0.5, "Cars", "MD",
1967, 0.5, "Industry static engines", "MD",
2020, 0.8, "Cars", "MD",
2020, 0.2, "Industry static engines", "MD") %>%
alloc_graph(country = "Example", ef_product = "Petrol", destination = "Transport")